This will be an ongoing post that I am using (for personal curiosity) to track the 2020 Stock Market Crash (which will probably be named something else in the future).
This will not be a timeline for the coronavirus. If you’re looking to compare stock news with coronavirus news, I recommend you use the New York Times timeline in conjunction with mine.
Timeline
May 23, 2019: Yield curve inversion. Dow Jones Industrial Average (DJI) closed at 25,490.47. This inversion has signaled the last 4 recessions.

December 31, 2019: This was not reported until April 22, 2020, but U.S. household debt reached a record high in Q4 of 2019.
January 19, 2020: First confirmed COVID-19 case in US.
February 12, 2020: DJI reaches all-time high of 29, 551. 42.
February 14, 2020: 20% of S&P 500 companies warn investors of coronavirus impact.
February 18, 2020: WalletHub reports average US household credit card debt is $9,000. This could be important to note given the potential job losses from the coronavirus.
February 18, 2020: Dallas Fed President Robert Kaplan said interest rates should stay where they are this year (1.5% to 1.75%). I’m just reporting this because it’s so far from reality.
February 21, 2020: 30-year Treasury yield drops to all-time low (1.892%)
February 25, 2020: DJI drops -956 points (-3.41%).
February 26, 2020: 10-year Treasury yield drops to record low of 1.30%
March 2, 2020: DJI rallies 1,113 points (4.35%)
March 3, 2020: DJI drops -845 points (-3.16%)
March 9, 2020: DJI drops -1,141 points (-4.57%)
March 11, 2020: DJI drops -1,051 points (-4.27%)
March 12, 2020: DJI drops -984 points (-4.44%)
March 13, 2020: DJI rallies 1,212 points (5.51%)
March 16, 2020: DJI drops -984 points (4.44%)
March 17, 2020: DJI rallies 750 points (3.66%)
March 20, 2020: DJI drops -1,079 points (-5.33%)
March 24, 2020: DJI rallies 983 points (4.98%)
March 26, 2020: DJI rallies 1,084 points (5.05%). The purpose of recording the previous drops/rallies was to display just how many +3%/-3% days there were.
March 21, 2020: Initial unemployment insurance claims reach 3.28 million – highest on record.

March 24, 2020: St. Louis Fed estimates 46% of work force is “high risk” for unemployment and Q2 unemployment could be 32.1%.
March 31, 2020: 89% of S&P 500 stocks have now triggered a MACD buy signal: highest in history (via @sentimentrader).

April 1, 2020: For the first time in over 15 years, Google Search Trends for “restaurant” and “delivery” are inverting.
April 1, 2020: Federal Reserve decreases supplementary leverage ratio rule to “ease strains in the Treasury market.” This may be caused by foreign debt sales as the $USD deflates.
April 2, 2020: Crude oil up 24.7% today. Largest daily gain in history.
April 3, 2020: Longest period of continuous employment growth in US history ended today. From October 2010 to March 2020 over 22 million jobs were added, but in the last month 16 million have been lost.
Pour one out for the longest period of continuous employment growth in U.S. history. It began in October 2010, lasted 9 years and 5 months, and brutally ended today.
— Justin Wolfers (@JustinWolfers) April 3, 2020
(The previous record of 4 years began in July 1986.)
The St. Louis Fed published a table of unemployment risks to expect by state.

April 6, 2020: President Trump discusses filling up nation’s oil reserves, providing more jobs, while oil is cheap.
President Trump discusses filling up nation’s oil reserves, providing more jobs, while oil is cheap. pic.twitter.com/HXaK3it1nU
— The Daily Wire (@realDailyWire) April 6, 2020
April 8, 2020: 31% of apartment renters paid no rent in April.
April 9, 2020: Federal Reserve provides additional $2.3 trillion in loans to “assist households and employers of all sizes.”
April 9, 2020: Dow was up more than 400 points, or 1.9%, which put the 30-stock average up more than 13% for the week, which would be its biggest weekly gain since 1938. This picture below frames just how crazy these times are.

April 10, 2020: Liberty street Economics publishes an article providing evidence this economic downturn is more like a natural disaster (i.e. Hurricane Katrina) than a cyclical downturn (i.e. GFC or Great Depression).
April 10, 2020: Small business layoffs increase +1,000% in March 2020.
April 10, 2020: Net asset purchases for G7 central banks exceed $1T in March 2020, close to five times the previous high of $270B in April 2009.

April 15, 2020: US industrial production plunges 5.4%, worst drop in almost 75 years.
BREAKING: U.S. industrial production plunges 5.4%, the worst drop since January 1946. Analysts had expected a drop of 3.5%. https://t.co/xVICT5pzYb pic.twitter.com/jlcKkIGeJY
— CNBC Now (@CNBCnow) April 15, 2020
April 16, 2020: The SBA announces it is currently unable to accept new applications for the Paycheck Protection Program (PPP).
April 16, 2020: US home construction down 22.3% in March.
April 16, 2020: Unemployment claims for week ending 4/11:
Unemployment Insurance Weekly Claims
— US Labor Department (@USDOL) April 16, 2020
Initial claims were 5,245,000 for the week ending 4/11 (-1,370,000).
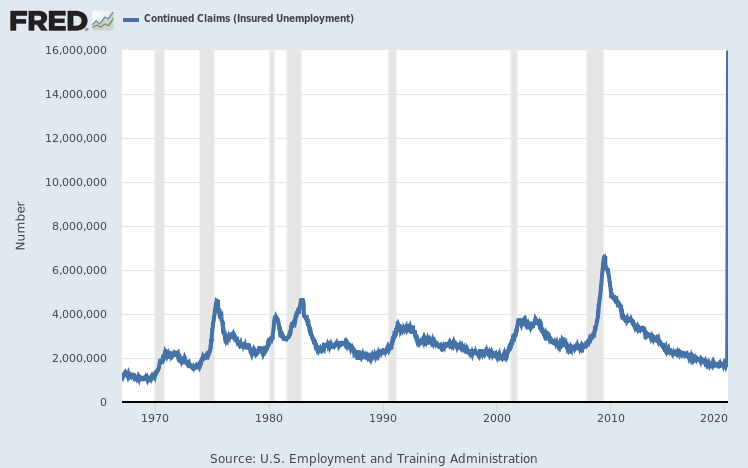
Insured unemployment was 11,976,000 for the week ending 4/4 (+4,530,000).https://t.co/ys7Eg5LKAW
April 22, 2020: Evidence surfaces of unemployed benefits outweighing employed benefits due to the CARES Act, PPP loan program, and unemployment insurance.
“Workers in more than half of states will receive, on average, more in unemployment benefits than their normal salaries.”
— Charlie Bilello (@charliebilello) April 26, 2020
Good policy?https://t.co/nPc7ywVZ42 pic.twitter.com/nGteFR6OLy
April 23, 2020: The number of continuing jobless claims is now up to 16 million. To put this into perspective ~12.5% of the labor force is on unemployment. Of the past 5 recessions none of them surpassed 5%.
April 23, 2020: U.S. new home sales fell 15% from February 2020 to March 2020; the largest Feb-Mar decline going back to 1962.
US New Home Sales fell 15% from February to March. This was the largest Feb-Mar decline ever w/ data going back to 1962. pic.twitter.com/A73eMTrfgL
— Charlie Bilello (@charliebilello) April 23, 2020
May 11, 2020: US Total Vehicle Sales hit their lowest level ever.
US Total Vehicle Sales hit their lowest level ever in April w/ data going back to 1976, breaking below prior recession lows in February 2009 and December 1981. pic.twitter.com/UgI3n8Axka
— Charlie Bilello (@charliebilello) May 12, 2020
May 12, 2020: US grocery costs jump the most in 46 years.
May 20, 2020: Number of unpaid credit card accounts in April increased 10,000% from a year ago. Number of unpaid auto loans up 350%. (source)
Additional Timelines
FRASER Library COVID-19 Pandemic – This is the Federal Reserve’s official pandemic timeline
CNBC Timeline (updated to April 13, 2020)

Leave a Reply